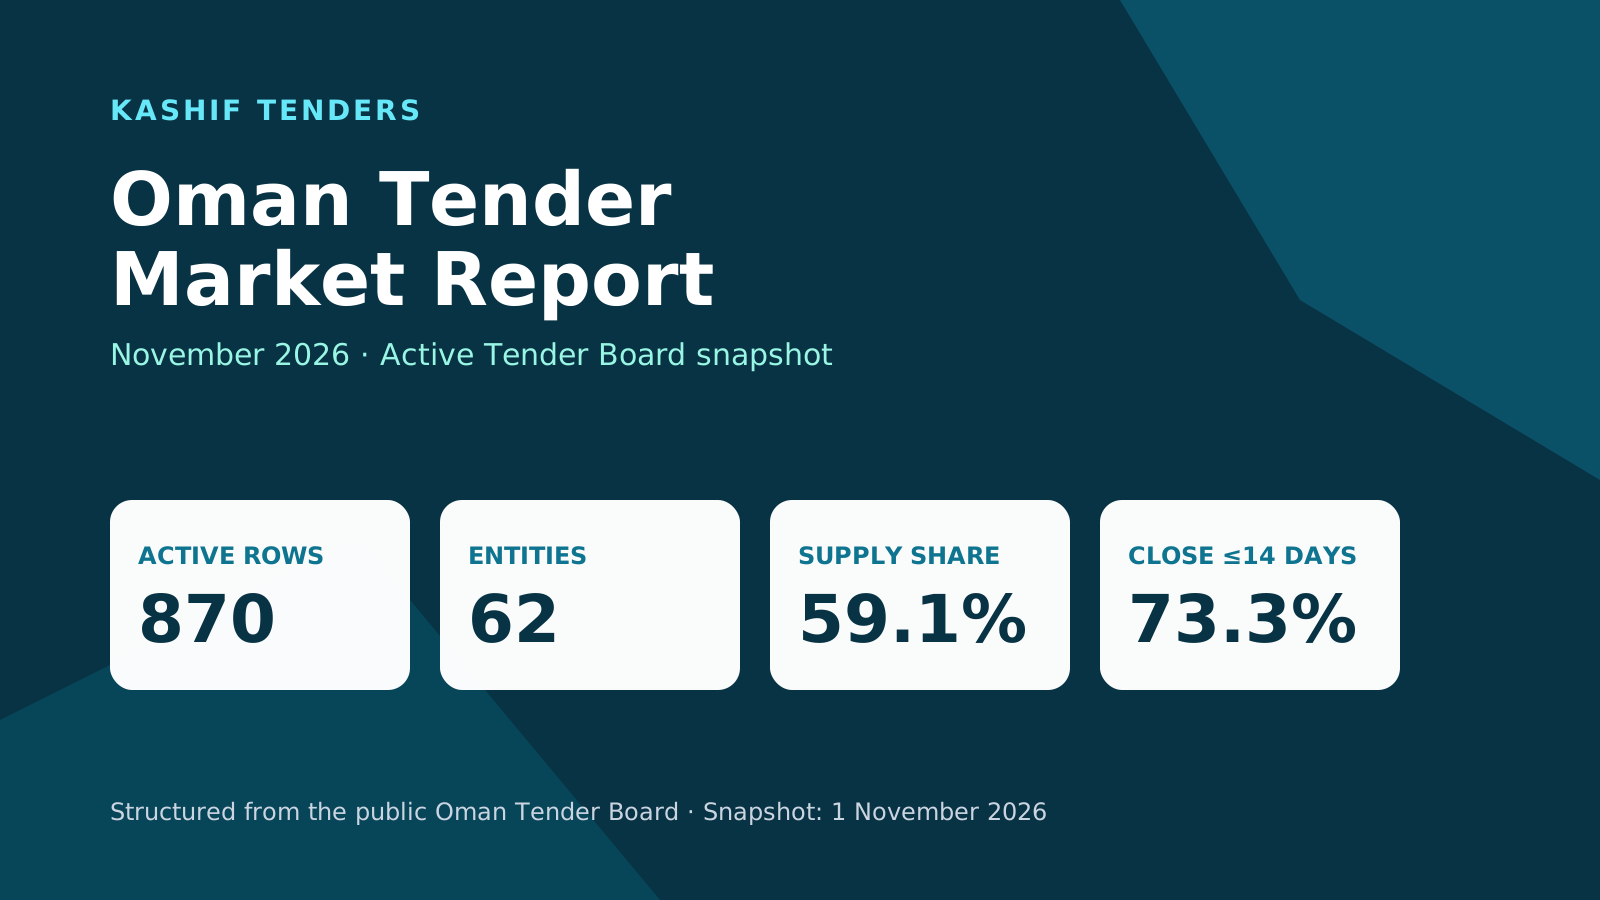
Oman's public tender pipeline is large, but it is not evenly distributed. In Kashif's structured Tender Board snapshot on 1 November 2026, 870 floated opportunities remained active. Five entities hold about two-thirds of them, supply is well over half the pipeline, and 73.3% of closing dates fall within the next 14 days.
This report is the durable Kashif market-analysis hub. It is refreshed at the same URL rather than republished, so the numbers below always describe the most recent snapshot. Last refreshed 1 November 2026; previous snapshot 2026-08-15.
Executive summary
- Opportunity is concentrated. The five most active entities account for 604 of 870 active rows (69.4%). The Ministry of Health alone accounts for 413 (47.5%).
- Supply dominates, but it is not the whole market. Supply contributes 514 rows (59.1%); services, construction and maintenance, IT, consulting and specialist contracting together contribute another 356.
- Supplier access is broad. SME and open tenders make up 811 rows (93.2%), split 450 SME to 361 open.
- Grade narrows the field where the work is technical. 632 of 870 rows (72.6%) accept every classification grade; the remaining 238 name a narrower range.
- Timing is the immediate constraint. 638 opportunities (73.3%) close within 14 days, and 403 had already passed their document-sales date at the snapshot.
What changed since the last refresh
The previous snapshot was taken on 2026-08-15. Comparing like for like, the market's shape is stable while its composition shifts at the margins.
| Measure | 2026-08-15 | 2026-11-01 | Change |
|---|---|---|---|
| Active floated opportunities | 990 | 870 | -120 |
| Entities represented | 64 | 62 | -2 |
| Ministry of Health rows | 446 | 413 | -33 |
| Top-five entity rows | 657 | 604 | -53 |
| Supply rows | 572 | 514 | -58 |
| SME + open rows | 903 | 811 | -92 |
| Closing within 14 days | 646 | 638 | -8 |
Entity concentration moved from 66.4% to 69.4% of the active base, and the Ministry of Health share moved from 45.1% to 47.5%. Urgency moved from 65.3% to 73.3% closing within 14 days. The clearest compositional shift is inside supplier access: SME rows moved from 403 to 450 while open rows moved from 500 to 361, so the pipeline flipped from open-majority to SME-majority between the two snapshots. A single comparison is a data point, not a trend; the next refresh extends this table rather than replacing it.
Market at a glance
The snapshot spans 62 entities and 8 Tender Board categories. These numbers describe active floated rows in Kashif's database, not contract value or a forecast of government spending.
| Measure | 2026-11-01 snapshot |
|---|---|
| Active floated opportunities | 870 |
| Entities represented | 62 |
| Tender Board categories | 8 |
| Top-five entity share | 69.4% |
| SME + open tender share | 93.2% |
| Open to every contractor grade | 632 (72.6%) |
| Closing within 14 days | 638 (73.3%) |
Kashif currently stores 57,469 Tender Board source records across awarded, opened and floated lifecycle states. That archive provides coverage context, but it should not be read as 57,469 unique active procurements or as procurement value. This report's market composition uses only the 870 active floated rows.
| Current stored lifecycle | Source records |
|---|---|
| Awarded | 32,683 |
| Opened | 21,929 |
| Floated, including closed rows | 2,857 |
| All stored Tender Board records | 57,469 |
Five entities hold about two-thirds of active opportunities
The entity ranking shows why a single generic "government tenders" watchlist is not enough.
| Rank | Entity | Active rows | Share |
|---|---|---|---|
| 1 | Ministry of Health | 413 | 47.5% |
| 2 | Ministry of Education | 56 | 6.4% |
| 3 | Ministry of Social Development | 53 | 6.1% |
| 4 | Ministry of Agricultural, Fisheries Wealth and Water Resources | 43 | 4.9% |
| 5 | University Of Technology And Applied Sciences | 39 | 4.5% |
| 6 | Ministry of Housing and Urban Planning | 22 | 2.5% |
| 7 | Ministry of Information | 21 | 2.4% |
| 8 | Ministry of Commerce and Industry | 14 | 1.6% |
| 9 | Environment Authority | 13 | 1.5% |
| 10 | Ministry of Heritage and Tourism | 11 | 1.3% |
The top ten entities account for 685 rows (78.7%). That makes entity monitoring efficient, but suppliers should not stop at the top ten: the remaining 52 entities still account for 185 opportunities, and a smaller entity may be more relevant to a specialist company than a high-volume ministry.
For a closer entity-level view, see the weekly Oman tenders by government entity, the Ministry of Health tenders hub, and the Ministry of Education tenders hub.
Supply leads a market with several meaningful service lanes
| Category | Active rows | Share |
|---|---|---|
| Supply | 514 | 59.1% |
| Services | 150 | 17.2% |
| Construction and Maintenance | 97 | 11.1% |
| Information Technology Services | 45 | 5.2% |
| Consulting Offices | 25 | 2.9% |
| Electromechanical and Telecommunications Contracting and Maintenance | 17 | 2.0% |
| Construction of Ports Roads Bridges Railways Dams and Maintenance | 15 | 1.7% |
| Pipeline Network Construction and Drilling Wells | 7 | 0.8% |
The first three categories represent 761 rows (87.5%). Category alone, however, is a coarse filter. "Supply" can mean medical equipment, laboratory consumables, furniture, spare parts or operational materials. Businesses need title, entity, qualification, deadline and detailed requirement matching before treating a row as a genuine lead.
For sector-specific views, see the weekly Oman construction tenders, Oman supply tenders, and Oman IT tenders hubs.
SME and open tenders split most of the pipeline
Tender type is an initial access signal, not an eligibility decision. The weekly Oman SME tenders and international tenders hubs break that split down by category, entity and deadline.
Contractor grade is the gate most watchlists miss
632 of 870 graded active rows (72.6%) accept every classification grade. The other 238 name a narrower range - and that restriction is concentrated in technical work rather than spread evenly across the market.
Grade restriction also runs in both directions: a notice narrowed away from the lowest grade is frequently narrowed away from the highest one too, so a top classification is not a superset of a lower one. The weekly grade hubs, such as tenders for fourth grade contractors, track each grade's reach by category and tender type.
73.3% of opportunities close within 14 days
Deadline pressure is the strongest operational finding. 420 active rows close within seven days, and another 218 close in 8-14 days. Only 36 extend beyond 30 days.
| Closing window | Active rows | Share |
|---|---|---|
| 0-7 days | 420 | 48.3% |
| 8-14 days | 218 | 25.1% |
| 15-30 days | 196 | 22.5% |
| 31+ days | 36 | 4.1% |
A bid-closing date is not the only clock. 403 of the 870 active rows had already passed their stored document-sales end date at this snapshot, so a future closing date does not prove a new supplier can still buy the documents. Internal qualification, partner quotations, bid bonds, approvals and submission preparation all consume further time.
The new Oman tenders this week hub shows the newly seen flow after this snapshot, and the tender match check counts how many open tenders fit a company. The hubs track weekly change while this report remains the durable market view.
What suppliers should do with this report
- Start with fit, not volume. Define the entities, requirements, categories, exclusions and qualification signals that match the company.
- Check grade before you read scope. A grade mismatch ends the review regardless of how well the requirement fits.
- Separate discovery from qualification. A broad category match should enter review, not automatically become a bid decision.
- Assign the near-term queue daily. With 73.3% closing within 14 days, an unowned watchlist quickly becomes stale.
- Treat document sales as its own deadline. 403 active rows had already passed it here.
- Verify on the source portal. Kashif is independent from Tender Board. Confirm live dates, documents, fees, eligibility and amendments before acting.
Questions the next refresh will answer
- Does the entity-concentration shift between 2026-08-15 and 2026-11-01 continue in the same direction?
- Which categories are adding genuinely new rows rather than only retaining long-deadline opportunities?
- Is the SME/open split changing?
- Does the share of rows open to every contractor grade move with category mix?
Methodology and limitations
The active analysis uses Kashif's structured sync of the public Oman Tender Board dashboard. It includes records where lifecycle_status = floated and bid_closing_at >= 2026-11-01. Full floated-list refresh; 5,000 rows seen and 557 changed. Month-over-month figures compare against the previous committed cornerstone factsheet dated 2026-08-15.
Entity, category, tender type, grade and closing-window counts use one row per stored Tender Board source record with no joins. Group totals reconcile to the 870-row active base. English and Arabic source labels are stored together; display labels were normalized only for readability, not to merge separate entities.
This is a Tender Board source snapshot, not a complete census of procurement across Oman. Counts do not represent contract value, budget, bid competitiveness, eligibility or likelihood of award. Awarded records are included only in the stored-coverage table; bidder, winner and price analysis are outside this report. Rows can change after publication, and the official source notice remains authoritative.